During the discussion of integrated rate laws (and more generally in science), you’ll often see people trying to bring some equation to a linear form.
For example, take the first-order reactions. There are two ways to represent the dependence of the concentration on the time:
The second form may even seem to be more useful as we can conclude something about the shape of vs dependence (it being an exponential decay). So why do we care about straight lines?
Estimating Order from Experimental Data.
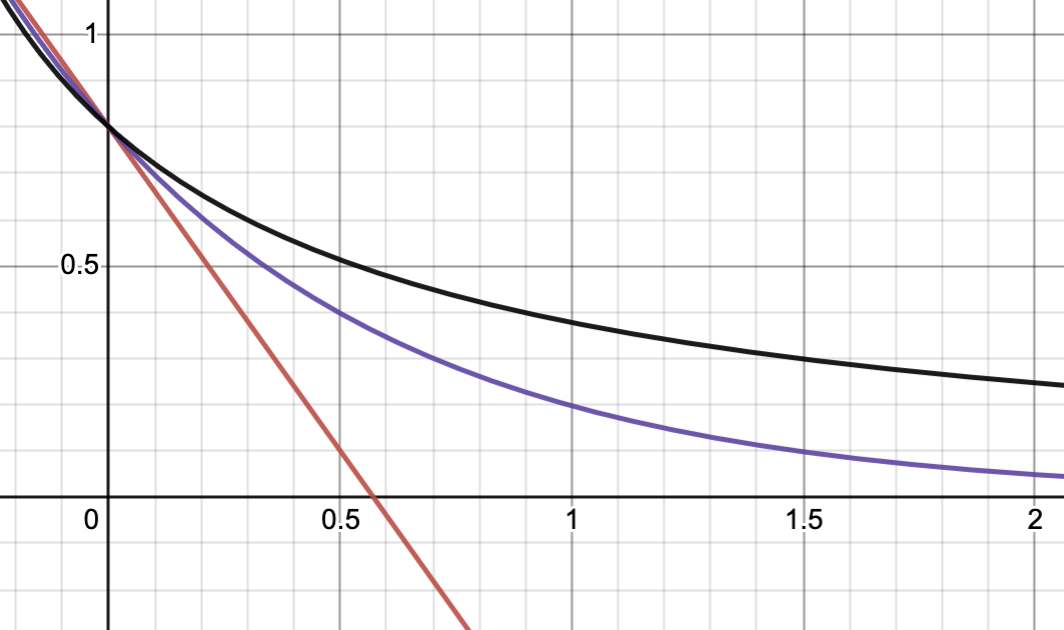
The problem at hand is that it’s not easy to differentiate first-order kinetics from second-order one. Let’s plot the integrated equations for 1st and 2nd order using our friend Desmos:
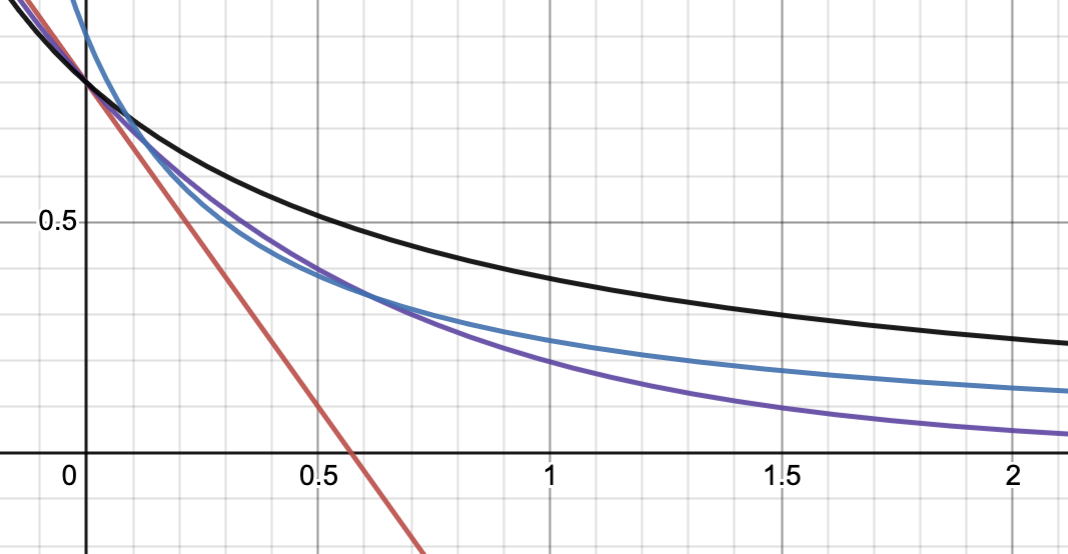
 the red curve is 0 order, purple is 1st order, and black is 2nd order. My math intuition tells me that the black line has a very similar shape to the purple line and if we vary the parameters ( and ), we might make them coincide. It took me a couple of seconds to achieve this:
 where the purple line is 2nd order with different parameters. It’s definitely different from the 1st order curve for large , but it looks very close for .
Now, let’s imagine you measure the concentration at regular intervals of time and you get a bunch of data points:
.png)
What is the reaction order with respect to ? Well, the data doesn’t look linear, so it’s definitely not a zero-order reaction. But is it 1st or 2nd order? It’s hard to tell!
Now, let’s look at the plots of the and : (disregard the y-axis title for these plots, it should be “inverse concentration” and “log concentration” respectively)
.png)
.png)
The second one looks way more like a straight line, so we might conclude that this is likely to be a first-order reaction. The key takeaway, is that we couldn’t have made this conclusion by looking at concentration directly.
Lines are easier to Fit
Okay, we established that the data above results from a process obeying first-order kinetics. Could we somehow estimate the rate constant and initial concentration ? In other words, can we fit that data to the equation:
If you were to live in 20th century the answer would be pretty much practically no. Even now, if you don’t know how to code (even with Python), the answer would be also pretty much no. Especially if we were to deal with something like a second-order kinetics, that’d be impossible to model directly with Excel.
However, it’s remarkably easy to find line of best fit for linear data. You can do this analytically using Least Squares Method.
Unless you can do Python
I firmly believe that anyone can learn Python to the level of being able to simplify your life and perform data analysis. With the same confidence, I believe that knowing python will give you a light-year boost on a job market, regardless of your vocation. Let me know if you want some advice on how to start learning python!
With python, we can do: ( is a collection of datapoints, is times at which they were taken)
import numpy as np
from scipy.optimize import curve_fit

def first_order(t, a_0, k):
	return a_0 * np.exp(-k * t)

popt_first, _ = curve_fit(first_order, t, y)
and the popt_first will contain optimal values of and . You could ask, oh my, could I also try & fit 0 and 2nd order? Yeah:
def zero_order(t, a_0, k):
	return a_0 - k * t

def second_order(t, a_0, k):
	return 1 / (1 / a_0 + k * t)

popt_zero, _ = curve_fit(zero_order, t, y)
popt_second, _ = curve_fit(second_order, t, y)
Nice. But can I quantify the quality of the fit, I don’t know, find R^2? Yeah:
from sklearn.metrics import r2_score
r2_zero = r2_score(y, zero_order(t, *popt_zero))
r2_first = r2_score(y, first_order(t, *popt_first))
r2_second = r2_score(y, second_order(t, *popt_second))
Can we plot this? Sure:
fig = go.Figure()
fig.add_trace(go.Scatter(x=t, y=y, mode="markers", name="Experimental Data"))

fig.add_trace(
	go.Scatter(
		x=t, y=zero_order(t, *popt_zero), mode="lines", name="Fitted to Zero Order"
	)
)

fig.add_trace(
	go.Scatter(
		x=t, y=first_order(t, *popt_first), mode="lines", name="Fitted to First Order"
	)
)

fig.add_trace(
	go.Scatter(
		x=t,
		y=second_order(t, *popt_second),
		mode="lines",
		name="Fitted to Second Order",
	)
)
Do you want me to tell you a dirty secret? I have Github Copilot (free for students), with which I simply wrote a comment
# add fitted curveand it generated the code above for me.
In fact, if we try to do this on data above, we get the following fits:
.png)
.png)
.png)
If you’re curious, I generated the data with this code:
t = np.concatenate(
				   (np.arange(0.1, 3, 0.1),
				   np.arange(3, 5, 0.2)))
a_0, k = 1, 0.5
y = a_0 * np.exp(-k * t) * np.random.normal(1, 0.1, len(t))
The first line essentially makes equally spaced times between 0.1 and 3 with a step of 0.1, and then between 3 and 5 with a step of 0.2 units. The second line defines parameters, and the third line creates an exponential decay with some noise (the noise is added by multiplying by some normal distribution around a factor of 1).
Which means that the optimal fit was pretty close to the true values of and !