What is the transition state? Why does it form? Does it seem to break the octet rule? Does it break other rules of chemistry?
The short answer is no. You can rationalize transition states without upending your understanding of chemistry. Today we’re going to look at the reaction of displacement of by :
This note will be structured as follows:
- We’ll look at how reaction proceeds visually
- We’ll see how the concept of transition state emerges from the reaction mechanism
- I will claim that a chemical bond can be viewed as a physical oscillator and show how that model naturally leads to both the shape of the energy diagram AND the existence of the transition state
Visualizing the chemical reaction
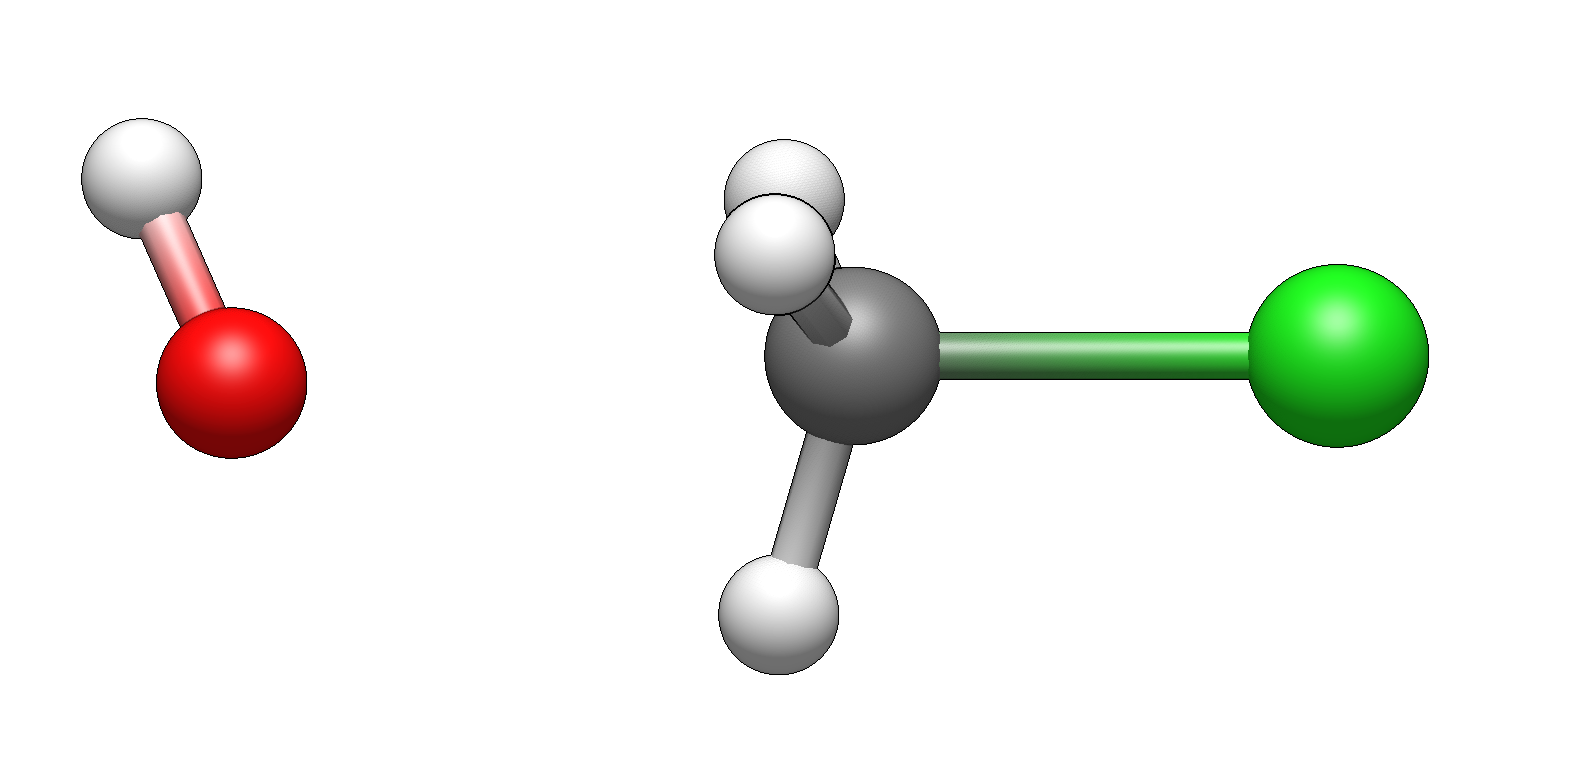
Here’s how reactants look like before reaction starts:
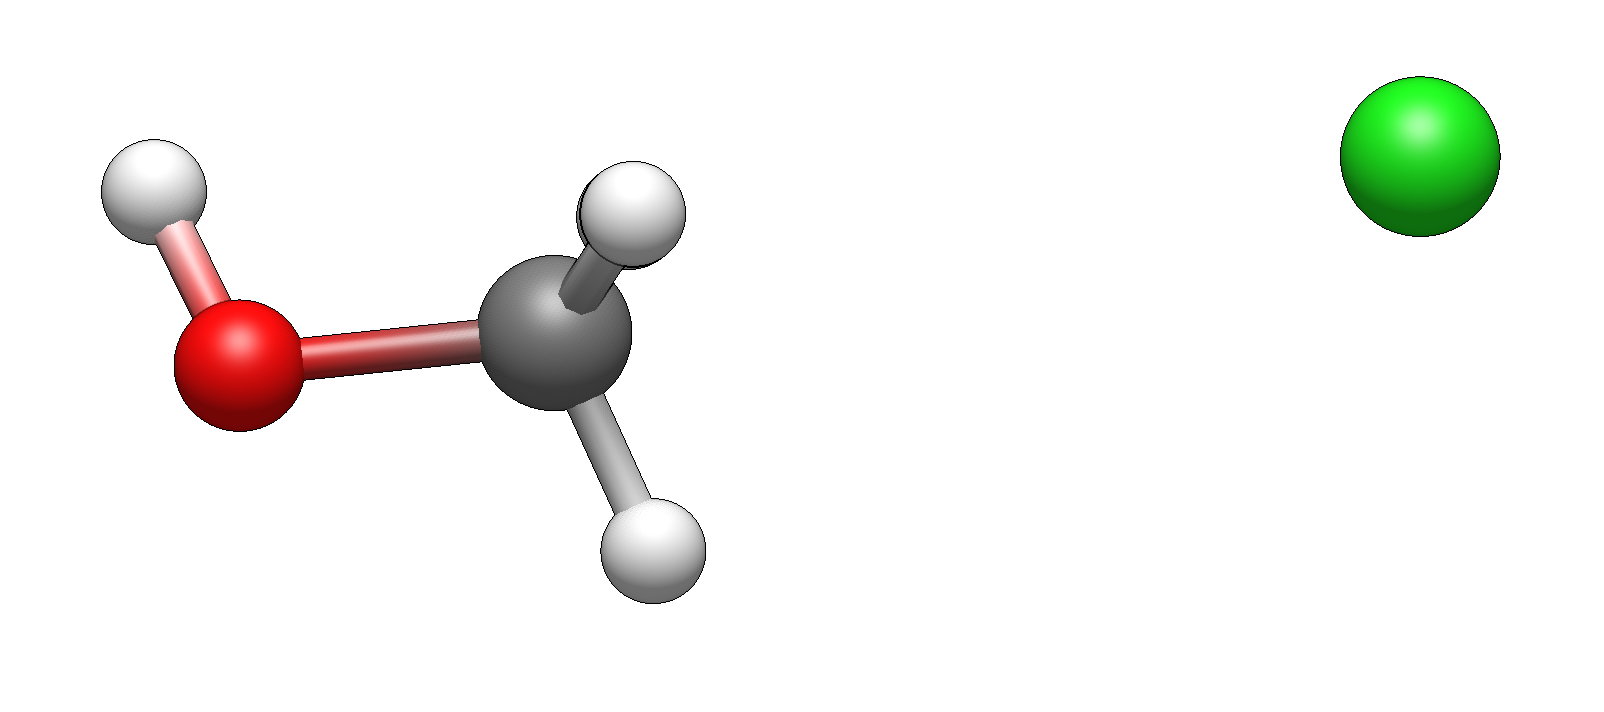
 and here are the products:
Now, take a pause and think for a moment: how would you imagine the reaction to proceed? What would be an intuitive movement of atoms? What would make the most sense? Have a picture in mind?
Now take a look at the actual model of this reaction.
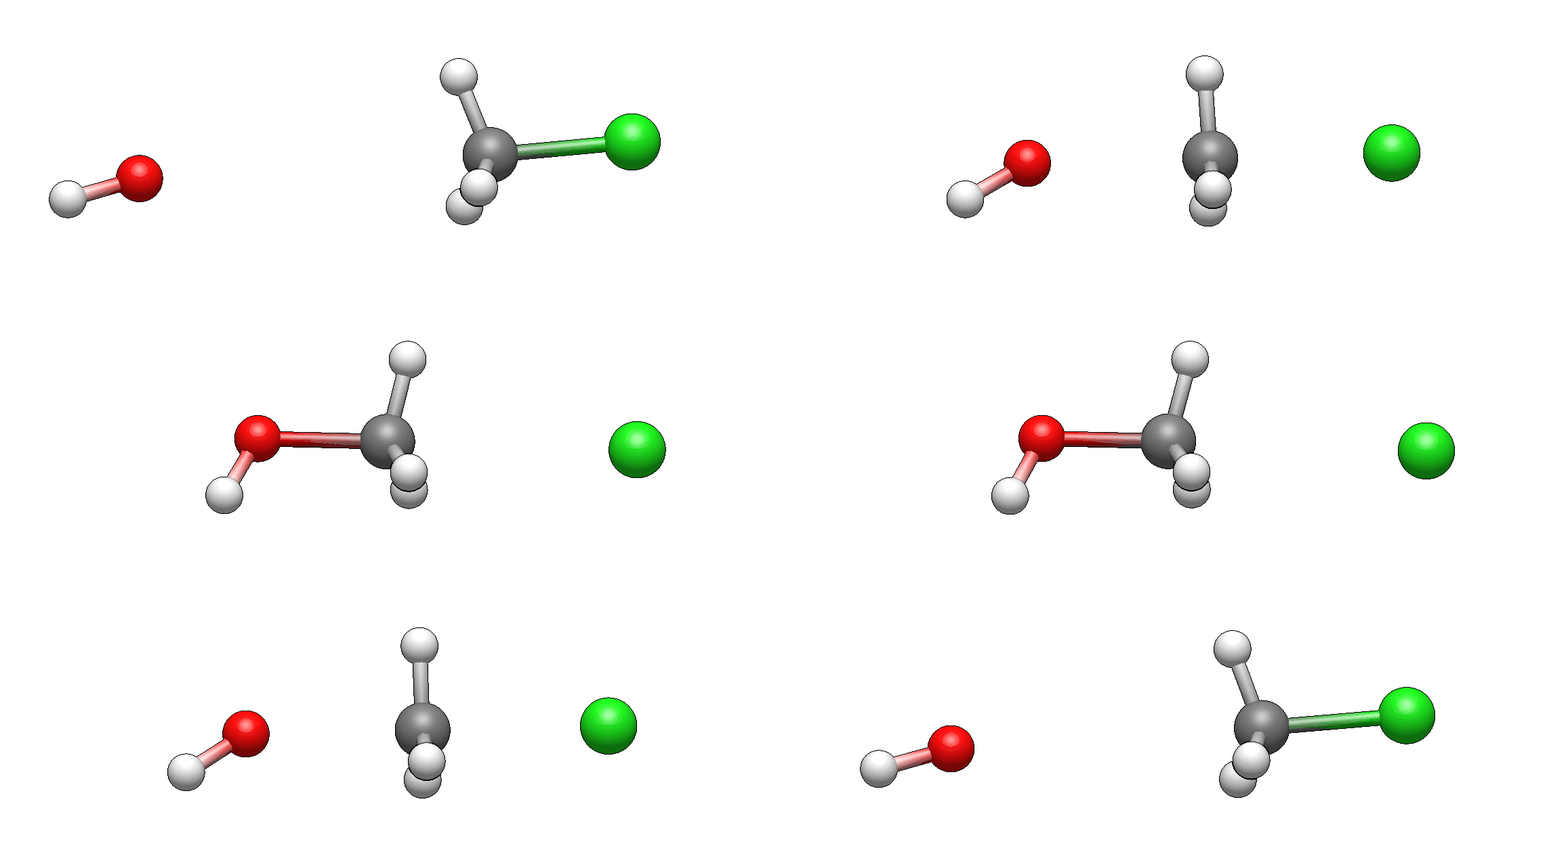
How does it differ from what you’ve imagined? I’m guessing it doesn’t look unexpected. If there’s anything unexpected, please let me know, I’d be very curious to hear it (I’m biased as I’ve seen such motions so many times that they seem intuitive to me, but this is only because I’m so familiar with them).
Let’s take a look at a few frames from this reaction:
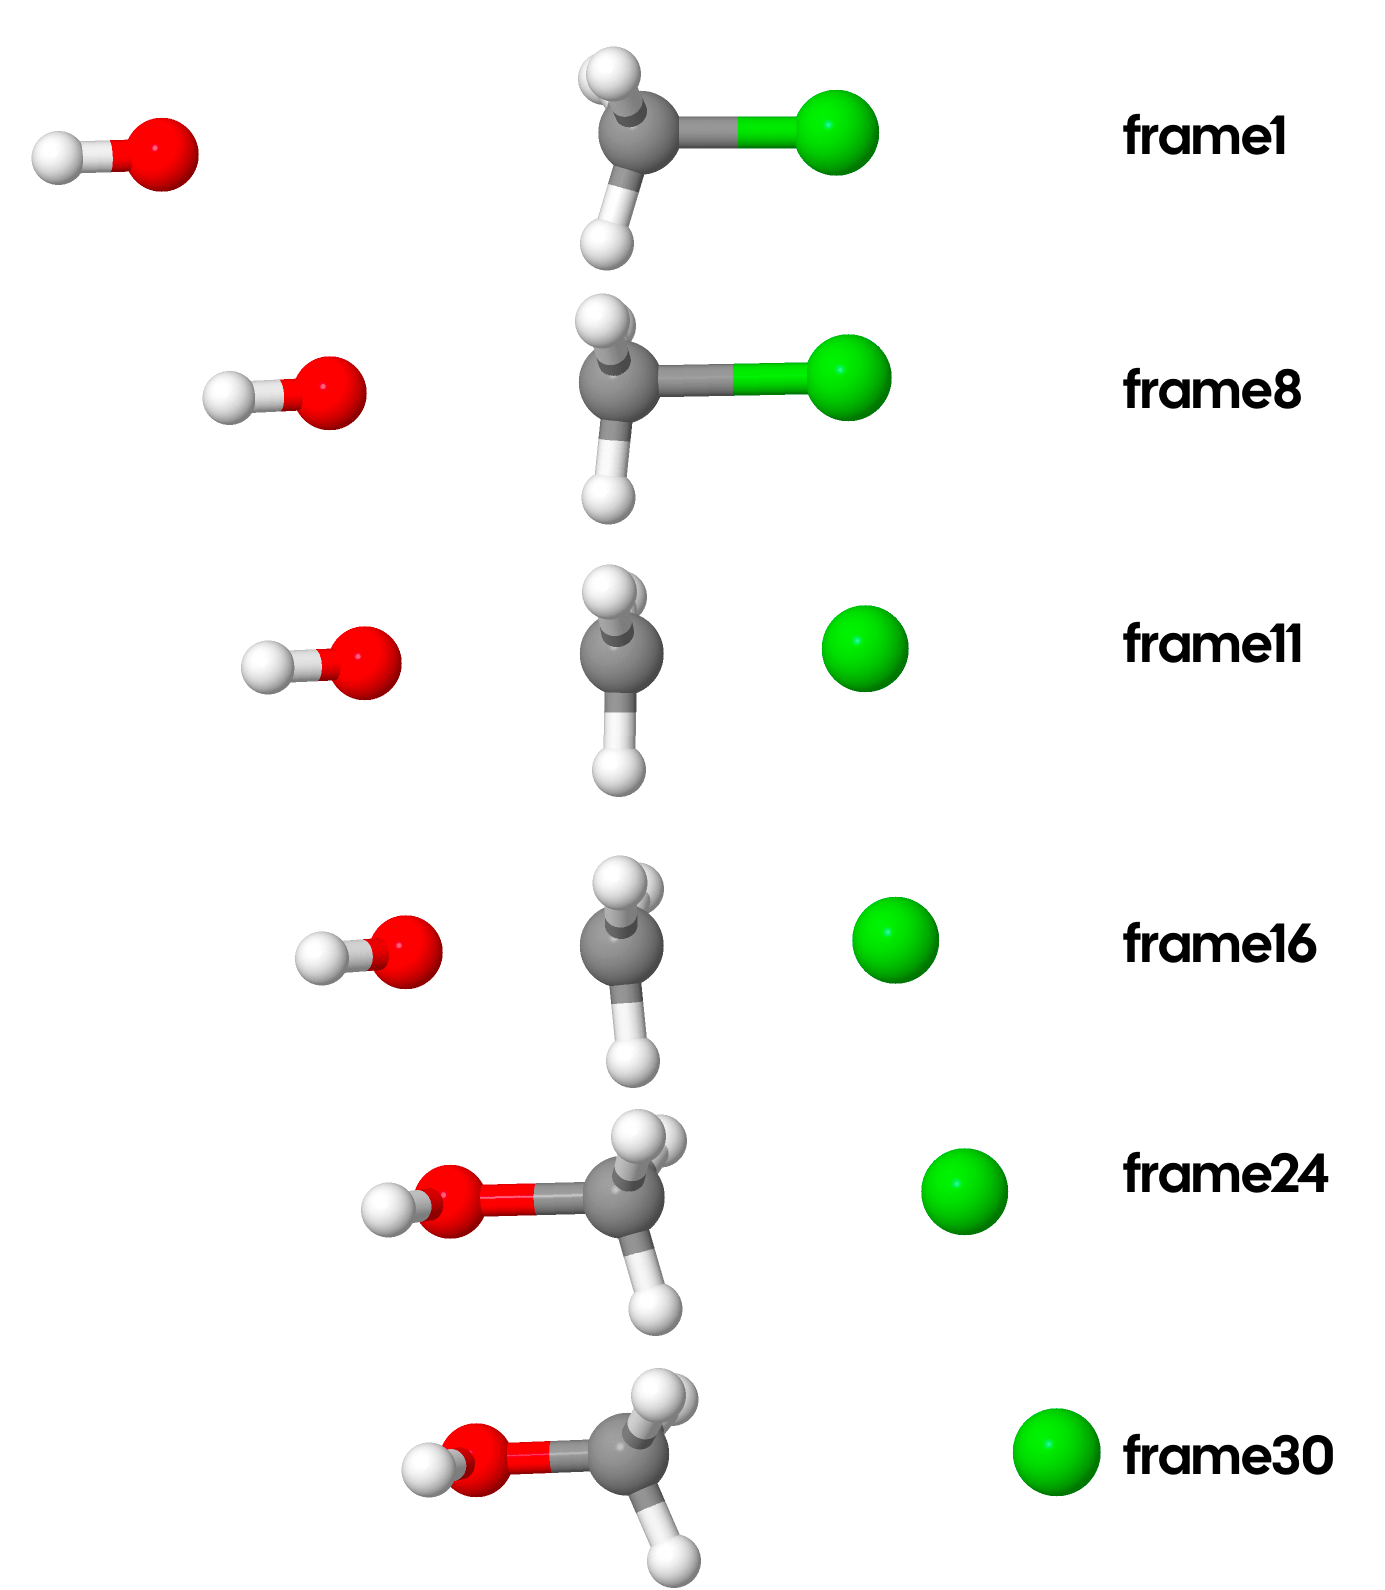
Do any frames look special? Personally, I wouldn’t say so. They all look like something in between reactants and products. The earlier frames look a bit more like reactants, while the later a bit more like products. Let’s actually look at a graph of energies for each frame:

Why might we want to give a special name to the state with largest energy? Mostly because it’s the point which defines the energy barrier of a chemical reaction. Remember we said that reactions happen when reactants have enough energy? The highest-energy point on the reaction diagram defines that how much is enough. Reactants should have enough energy to reach the transition state.
So if we can describe the factors that affect the stability of the transition state, if we can somehow make the transition state more stable (by changing the nature of reactants), we will decrease the energy barrier and so make the reaction faster. The whole field of research in catalysis is predicated on this idea. Chemists have two parts of a molecule: one which reacts and which creates some desired functional group, and there’s another, which doesn’t participate in the reaction directly, but could affect the stability of the transition state. By tuning that second part, they can stabilize the transition state and speed up the reaction rates.
Model of a Chemical Bond
Revisiting Harmonic Oscillator
At this stage, we need to start being a bit more specific about the kind of energy we talk about. The energy diagram above shows the potential energy during the chemical reaction. Reactions happen when molecules have enough kinetic energy to climb the hill of the potential energy. This notion may be familiar if you remember the harmonic oscillator from high school physics.
Image you have some mechanical spring attached to some block with mass .

It’s important to remember the forces at play. At the system is at potential energy. However, whenever , the springs wants to contract back to equilibrium, and whenever , the spring wants to expand. The potential energy depends on as , where is the constant parameter showing the strength of the string. You might notice that the potential energy is a parabola, i.e. it looks like . The movement of the oscillator occurs if at it has some non-zero velocity (in either direction), and if it has non-zero velocity, it has some kinetic energy .

Now, the key idea we need is the conservation of energy, which states that the sum will be constant. As a result, if we start at , with some positive velocity (which corresponds to some kinetic energy , the spring will expand to the point, at which all of that kinetic energy will be converted to potential energy, that is:
In other words, the spring will not reach the values of (the in the picture above refers to exactly ). And actually it won’t reach points as well. Here’s the time evolution of position, potential energy, kinetic energy, and total energy:
Notice how the peaks in potential energy (energy increases from left to right) correspond to the minima in kinetic energy and vice versa, but their sum is constant.
As you climb the hill of potential energy you start losing the kinetic energy, and the amount of kinetic energy you have at the beginning determines how far can you go. This is the most important takeaway that we need.
By the way, it turns out that the law of conservation of energy logically follows from the fact that the laws of physics are independent of time. In other words, because the laws of physics are the same today as they were yesterday and will be tomorrow, the energy is conserved. Such time-invariance of the system is a particular example of a symmetry (just as something can be symmetric with respect to rotation, like a ball, the system can be symmetric with respect to time). The link between symmetries of a system and conservations of particular quantities was proven by Emmy Noether and is now known as Noether’s Theorem, which imho is one of the most beautiful and important theorems in all of physics.
Chemical Bond as an Oscillator
Let’s focus on the chemical bond . Let’s call the distance between the two atoms . What should be the value of ? Well, it should be small enough to reap the benefits of Coulombic attractions between electrons of and nucleus of (and vice versa), but should be large enough for this attractive stabilization to not be overrun by Coulombic nucleus-nucleus and electron-electron repulsion. In other words, there’s some sweet spot in the values of , let’s call it to stand for equilibrium distance. How does the potential energy depend on ? Well, should be at minimum for , and whenever we lose some energy of attractions, so should increase. Similarly, whenever we gain more nucleus-nucleus repulsions, so should increase as well. If this sounds awfully similar to the harmonic oscillator, it is! To the first approximation, one can model as:
where behaves just like in the harmonic oscillator above!
Now, it turns out that contracting the length of chemical bond is more destabilizing than expanding it. Try to see why it should make sense: when you decrease , there’s no way to avoid nucleus-nucleus or electron-electron repulsion, things are too close to each other. As you increase , you allow nuclei to be farther from each other (decreasing the contribution of repulsions), while allowing electrons to be relatively close to each nuclei. Let me know if you don’t see why this is true.
As a result, if we want to model a chemical bond, should penalize more than . It turns out, there’s a pretty simple model for this called the Morse potential:
Here’s how it looks like:

Potential Energy Surface
Just as we can model the potential energy of bond length, we can model the potential energy of as a function of its length. And in fact, we can write the dependence of on every parameter that is needed to specify the orientation of all atoms exactly (all bond lengths, all bond angles, etc), and such function is called the potential energy surface. Remember that we started by looking at the reaction:
Let’s imagine we fix the position of and the only thing which changes is the distance denoted and distance , denoted . If we plot potential energy as a function of these two distances, we’ll get something like this:
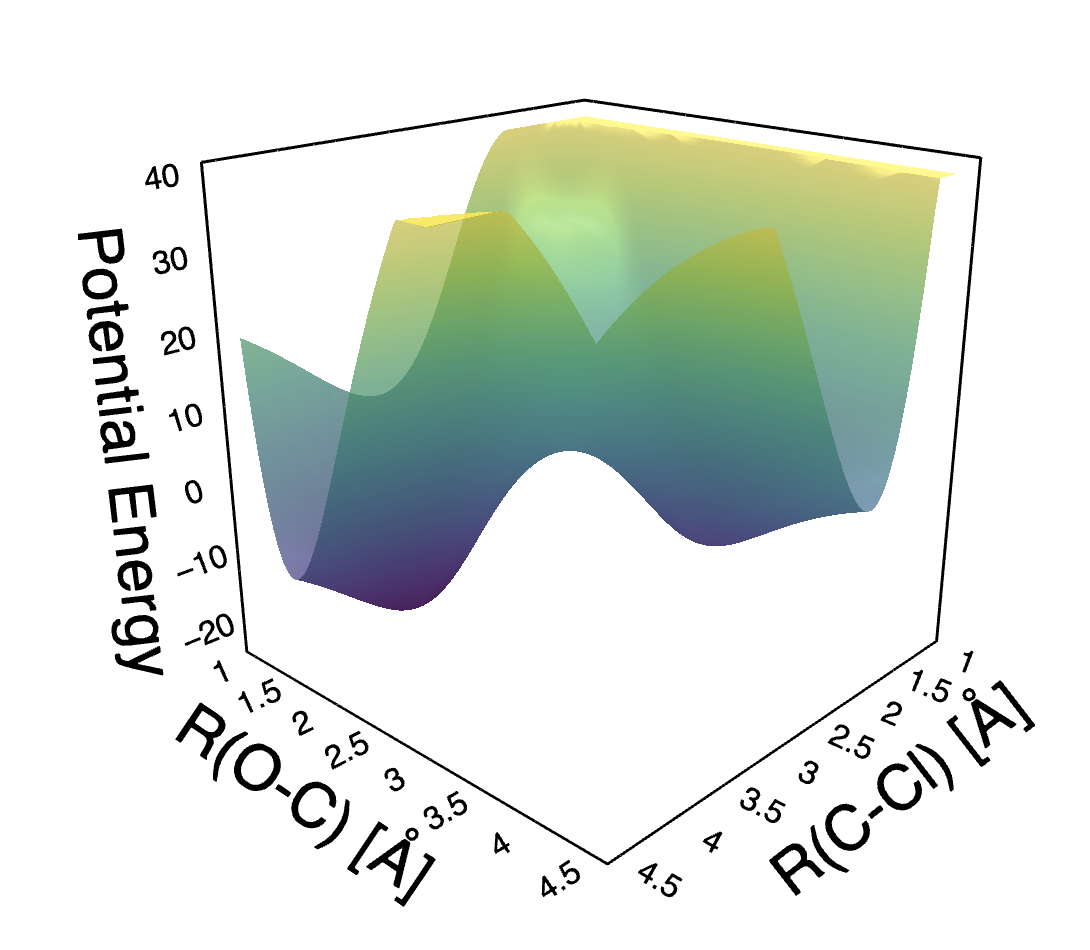
Here’s an interactive version of the figure. If you open it, you should be able to rotate the surface and study its details.
Let’s take a top-down view and label a few points and explicitly write out the correspondence between the points on the potential energy surface (PES) and locations of atoms:
![[[email protected]]]
Chemical reactions, in essence, are movements on this potential energy surface. We start at point B and we need to get to point D. How does reaction proceed? It proceeds through the easiest possible path! (also called minimum energy pathway, MEP). And now, if you take a side view of the PES:
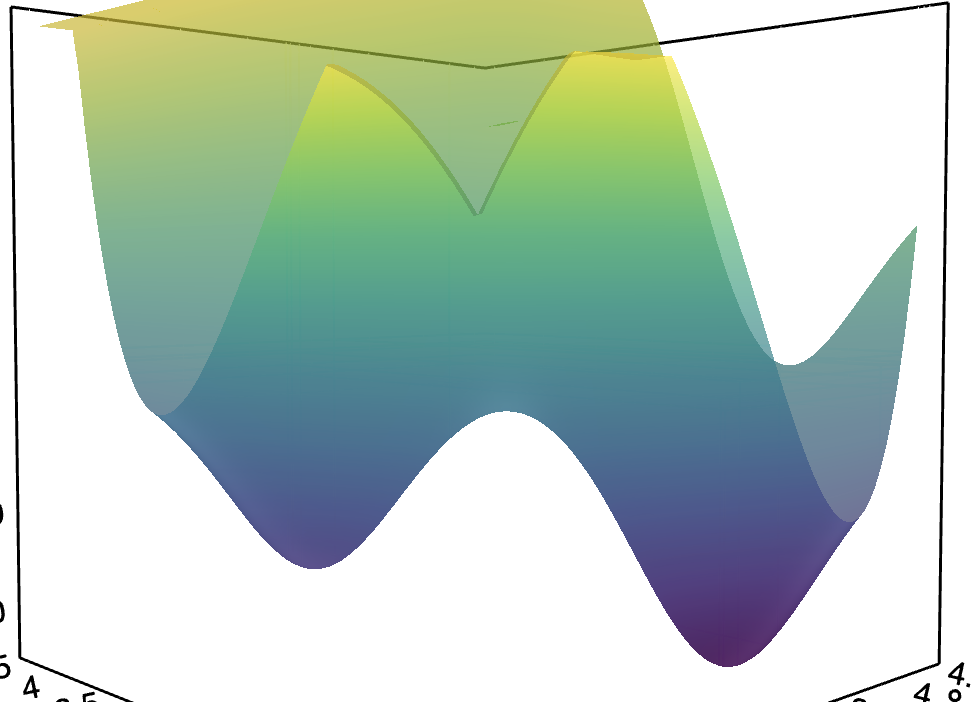
you see a very familiar curve! So the curve we usually draw is just a 2D slice of the multi-dimensional PES and it represents the minimum energy path between reactants and products! Also, remember, that we’re still looking at the potential energy surface, i.e. there’s no kinetic component added anywhere. So now, we can borrow the lesson we learned from the harmonic oscillator:
As you climb the hill of potential energy you start losing the kinetic energy, and the amount of kinetic energy you have at the beginning determines how far can you go
which means that reactions happen when you have enough kinetic energy to climb the hill on which the MEP lies!
![[[email protected]]]
If you look carefully, there’s something special about the transition state besides being the point with the highest energy on the MEP curve. It’s also the lowest point among the high-energy states around it! In other words, it’s the lowest point which is on the path between point B and D. If you’ve taken multivariable calculus, it’s a saddle point. But conceptually, what’s important is that it’s a point which characterizes the path that connects reactants to products (another name for this path is the mechanism of the reaction).
Let’s go back to the top-down view:
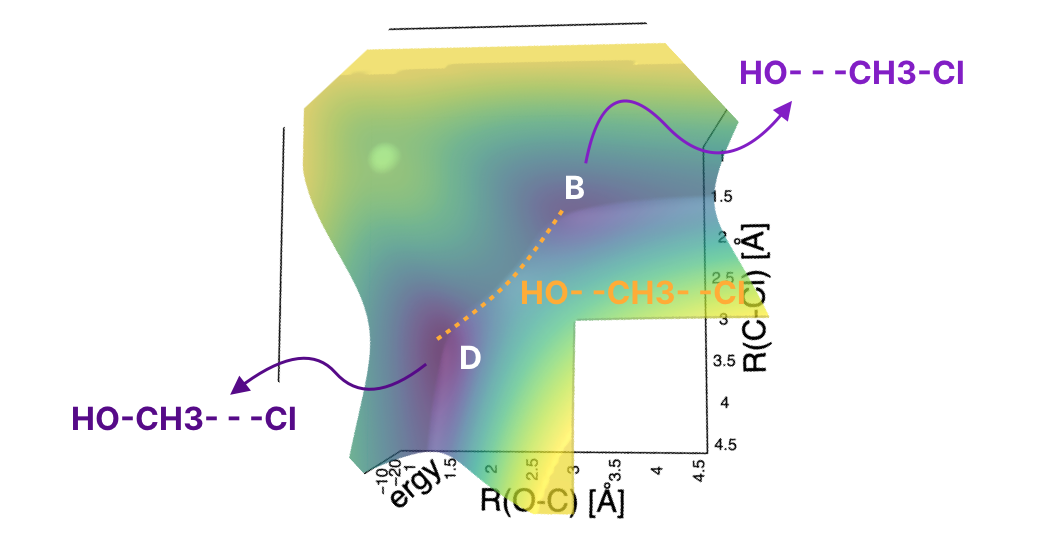
notice that as you move from point B to point D, you move in the direction of decreasing R(O-C) and the direction of increasing R(C-Cl) at the same time. The first distance decreases concurrently with the increase of R(C-Cl). Which is, essentially, what we saw in the animation at the beginning of this note.
The Elephant We Kept Ignoring
We spent so much talking about the chemical reaction and yet we said almost nothing about the electrons. They’ve been there all along — we just didn’t see them. If we include them in the picture, here’s what happens:

The mesh that you see is the molecular orbital, something which shows where the electrons are moving around in a molecule! Most of the information above was related to how the reactions happen (by moving along minimum energy pathway on a potential energy surface). The electrons are why reactions happen. Creation of new molecular orbitals (and destruction of existing) drives the reaction in one direction or another.
In fact, if you dive into quantum mechanics, you’ll be able to show that the shape of the potential energy surface is determined by the electrons!
